
Start Assessment Below

Business Readiness Assessment

State of Small Business Ops 2026
2-Minute
Assessment
Readiness
Snapshot
Reduce
Risk
Support
Growth or Exit

Quick. Practical. Actionable insights to strengthen your business today and tomorrow.
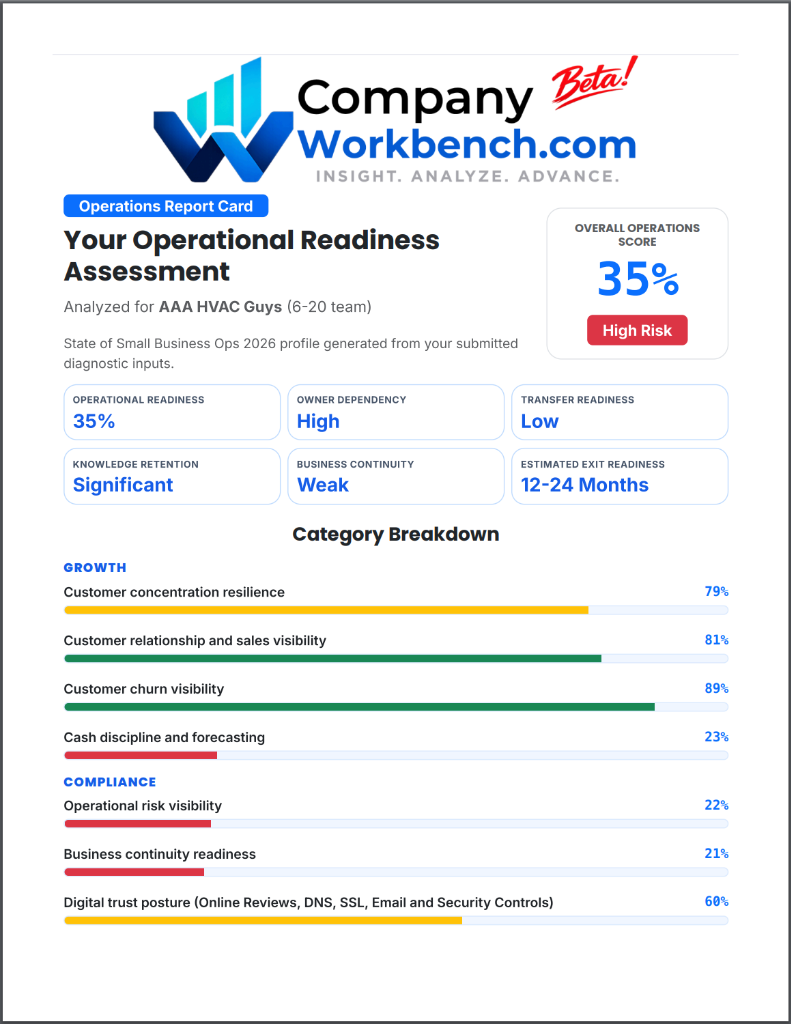
See the hidden drag Spot weak points across vendors, people, cash, continuity, customer records, digital trust, and process discipline.
Get a benchmark lens Compare operational leverage, continuity, owner dependency, and acquisition readiness signals instead of guessing.
Leave with next actions Receive a short advisory summary you can use internally or bring into a consulting conversation about what to fix first.

We will generate a tailored, benchmark-style advisory summary and follow-up plan.

1. Business Profile
2. Executive Snapshot
3. Business Readiness Diagnostics

Score how controlled each operating area feels today.

0-30Mostly ad hoc, manual, or undocumented. 40-70Some structure exists, but gaps still create drag. 80-100Consistently tracked, reviewed, and controlled.

Example: if vendor renewals are tracked in a spreadsheet but reviewed only when someone remembers, score that around 45-60.

50%
Auto-renewals slip through quietly All contracts tracked & reviewed
50%
No formal threat monitoring Weekly risk reviews & mitigation plans
50%
Warranty expiration / maintenance is random Full logs, warranty warnings, scheduled reviews
50%
Tribal knowledge, high employee dependency All major processes written down & assigned
50%
Meeting actions are frequently forgotten Every choice logged with delegated actions
50%
Single points of failure across key roles Cross-trained backups in critical functions
50%
Revenue at risk if a few customers leave Diversified base and early churn warning signals
50%
New employees learn through shadowing Formal onboarding and employee records
50%
Tasks tracked through memory and email Tasks assigned, tracked, and reviewed
50%
Customer information scattered Centralized customer records and history
50%
No reliable run-rate or reserve visibility Forecasting, reserve policy, and cash guardrails in place
50%
No tested recovery or continuity playbooks BCP drills and documented recovery paths maintained
50%
Unknown public exposure and weak controls Monitored digital footprint with proactive hardening
4. Transferability and Risk Signals
5. Hidden Revenue Leakage

Where might money, time, or enterprise value be quietly leaking?

Rate how controlled each leakage area feels today. Lower scores suggest higher potential drag from missed renewals, overspend, downtime, churn, or turnover.

50%
Renewals surprise the team Renewals forecasted and acted on early
50%
Spend reviewed reactively Spend benchmarked and optimized
50%
Churn risk is hard to see Churn warning signals are tracked
50%
Downtime is discovered too late Maintenance and replacement are planned
50%
Key roles have fragile backup coverage Turnover impact is reduced by systems
6. Strategic Report Delivery

Transparency note: this is a free diagnostic and lead assessment. We use your answers to generate your report and understand whether CompanyWorkbench.com or advisory support may be useful. No perfect answers are needed; honest estimates create the best recommendations.